Oklahoma City Open Data
Infrastructure
Impervious Surfaces
A map of paved and other water-resistant surfaces across the city, captured from aerial photos in 2020
Source city: Oklahoma City · Catalog date: June 9, 2026 · License: custom
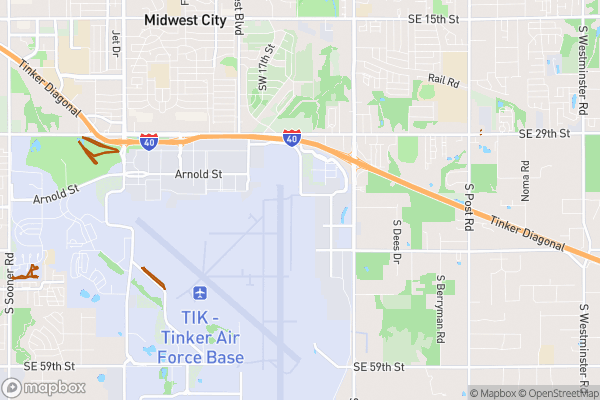
What this is
A map of paved and other water-resistant surfaces across the city, captured from aerial photos in 2020.
Why it matters to you
Impervious surfaces affect flooding risks, water drainage fees, and urban heat. If you’re considering paving a driveway or parking lot, this data shows existing coverage patterns that influence runoff calculations. City planners use this to prioritize green infrastructure projects in areas with high pavement concentration.
How to read this data
- Surface Type: What kind of paved surface (e.g., asphalt, concrete, rooftop)
- Area: Size in square feet (helps estimate stormwater impact)
- Shape: Geographic outline (useful for seeing exact boundaries of paved zones)
Where this leaves you
While you can’t look up your exact property here, this dataset helps explain why some neighborhoods flood more than others during heavy rain. Check your local stormwater utility website for parcel-specific runoff rules.
(Word count: 150)
The fields, explained
Pulled directly from the source catalog's published field definitions — not paraphrased.
| Field | What it means |
|---|
ObjectID | Numeric unique identifier with no special meaning |
Surface Type | Indicates the category of the surface |
Shape | Geographic data in state plane coordinates (WKID 103512) |
Length | Approximate length of perimeter of feature in US feet |
Area | Approximate area of feature in US square feet |
From the source — real records
Unedited rows from Oklahoma City's published service, pulled when this site was built.
Look it up yourself
Everything on this page comes from the city's public open-data catalog. Anyone can download it — CSV, GeoJSON, KML, or the live service.
This explainer was written from the published catalog record. Always verify against the source dataset before relying on it for a decision.