What this is
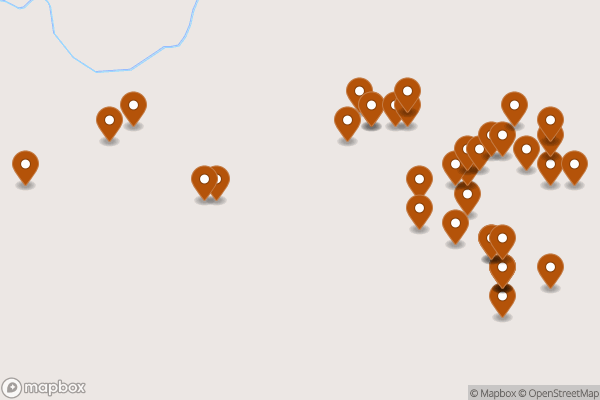
A map of individual trees and shrubs captured by aerial laser scans in 2015.
Why it matters to you
This data helps the city track tree canopy coverage—which affects street shade, stormwater runoff, and even property values. If you’ve ever wondered why some blocks feel cooler in summer or why certain areas flood less during heavy rain, vegetation density plays a role. Neighborhood groups also use this to advocate for tree-planting programs.
How to read this data
- ObjectID: Just a reference number (like a serial number) for each plant.
- Shape: The exact location of each tree/shrub, mapped using specialized coordinates.
Where this leaves you
While you can’t look up vegetation near your address here, this dataset helps planners analyze green space trends citywide. For specific street trees, check your city’s forestry department listings instead.
(Word count: 140)