What this is
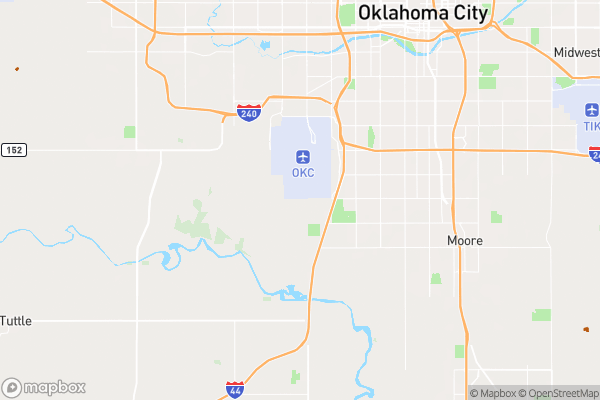
A map of tree canopies and other vegetation areas from 2015 laser scans of the city.
Why it matters to you
This data helps track where trees and plants exist across neighborhoods. City planners use it to spot areas needing more greenery, prioritize tree planting near heat-vulnerable streets, or identify where overgrown vegetation might block sidewalks. Homeowners might check if a large tree on their property appears in this dataset before pruning or removal permits.
How to read this data
- Shape: The outline of each vegetation patch (like a tree’s canopy or a shrub cluster)
- Area: Size of the vegetation patch in square feet (helps compare green space between neighborhoods)
- Length: Total distance around the edge of the vegetation patch (indicates how sprawling it is)
Where this leaves you
While you can’t look up specific addresses, this snapshot helps advocate for more tree cover in your area by showing where vegetation gaps exist. Note: Data is from 2015 and updated only every few years, so newer plantings won’t appear.